Making Business Rules Executable for Data Agents
An agent asked to 'report sales' needs more than permission to query the database. It needs to know which calculation the business intends, and it needs a way to execute that calculation without silently changing its meaning.
This article follows that problem from an ambiguous request to checked SQL and a shared metric interface. The shop below is a small synthetic example; the broader issue is how a data-agent workflow carries business rules into execution. We use sutura for one implementation and inspect what it enforces and what it leaves to us.
A small online shop is reviewing its October promotion. The operations report shows $470 in paid order value. An analyst, accounting for refunds on those orders, gets $375. Someone asks the AI assistant: 'How much did we sell in October?'
Before comparing answers, the team needs to choose which decision it is making. Are they describing the value of orders invoiced that month, or the value remaining after refunds known so far?
The amounts come from the synthetic dataset used in the experiment below, so every difference can be inspected. The $470 and $375 reports describe possible uses of that data; no real merchant incident or dashboard deployment is being claimed.
This class of discrepancy exists in real reporting systems. Shopify documents differences between reports and exports caused by timing and reporting logic, including distinct treatment of returns, refunds and test orders.[1] Our example uses its own paid-order and refund rules; it does not reproduce Shopify's sales calculations.
First decide what the number is for
For this shop, the analyst wants to review the net value of October's paid, non-test orders, after every associated refund in the fixed dataset. It is a management view of an order cohort: a group selected by invoice date. It is not net profit, a bank payout or an accounting revenue-recognition policy.
Seven orders qualify. Their original value is $470. Refunds on those orders total $95: $47 processed in October and $48 in November. The chosen calculation is:
October paid order value                 $470
Less refunds on those orders in October  -$47
Less refunds on those orders in November -$48
October order-cohort net value           $375
Consider one order: it was invoiced for $100 on October 31 and partially refunded by $25 on November 3. In this cohort view, it contributes $75 to October. A refund-activity report would instead record that $25 refund in November. The date question changes the report's meaning.
An October report can therefore change when later refunds arrive. The team must say whether it wants a current restatement or a frozen month-end snapshot. The experiment used one fixed synthetic snapshot; it did not implement historical snapshot storage.
For a real shop, the conversation also needs to cover discounts, tax, shipping, currency conversion and settlement. Those fields were not modeled here. The $375 figure alone cannot establish whether the promotion was profitable or should be repeated.
Prepare a definition that a developer can implement
The first deliverable is a short, reviewed metric definition. For this example, it would say:
| Decision to settle | This example's choice |
|---|---|
| Business question | What net value remains in the selected invoice cohort? |
| Owner | Commerce analytics, with the business stakeholder approving the policy |
| Unit of calculation | One order before aggregation; integer USD cents |
| Included orders | Paid orders; test orders excluded |
| Period | Invoice timestamp, UTC; start included, end excluded |
| Refunds | All known refunds associated with the selected orders, including later months |
| Product filter | Whole orders containing WIDGET, counted once; not revenue allocated to WIDGET lines |
| Missing rows | An empty observed total is zero; missing source data is a separate failure |
| Version and snapshot | Record which definition and source snapshot produced the answer |
An agent should not silently invent these policies. Once they are agreed, it can translate a question into the metric name, period and permitted breakdown.
The terms also need a data map. 'Order' points to an order ID, 'region' to the customer's region, and 'refund' to records related by order_id. dbt's semantic-model documentation makes these distinctions explicit through entities, time dimensions and grouping dimensions.[2]
Make the rows match the definition
A written definition still needs correct SQL. Check what one row represents after each join.
The fixture contains a $90 order with two refund records: $2 and $3. A direct join produces two rows, each carrying the original $90 order amount. Summing gross_cents - amount_cents over those rows gives $88 + $87 = $175. The intended result is $90 - ($2 + $3) = $85.
That is a deliberately incorrect, hand-written SQL example executed on the fixture. The model did not make this mistake in the recorded trials. It shows a failure that the data model and tests should prevent.
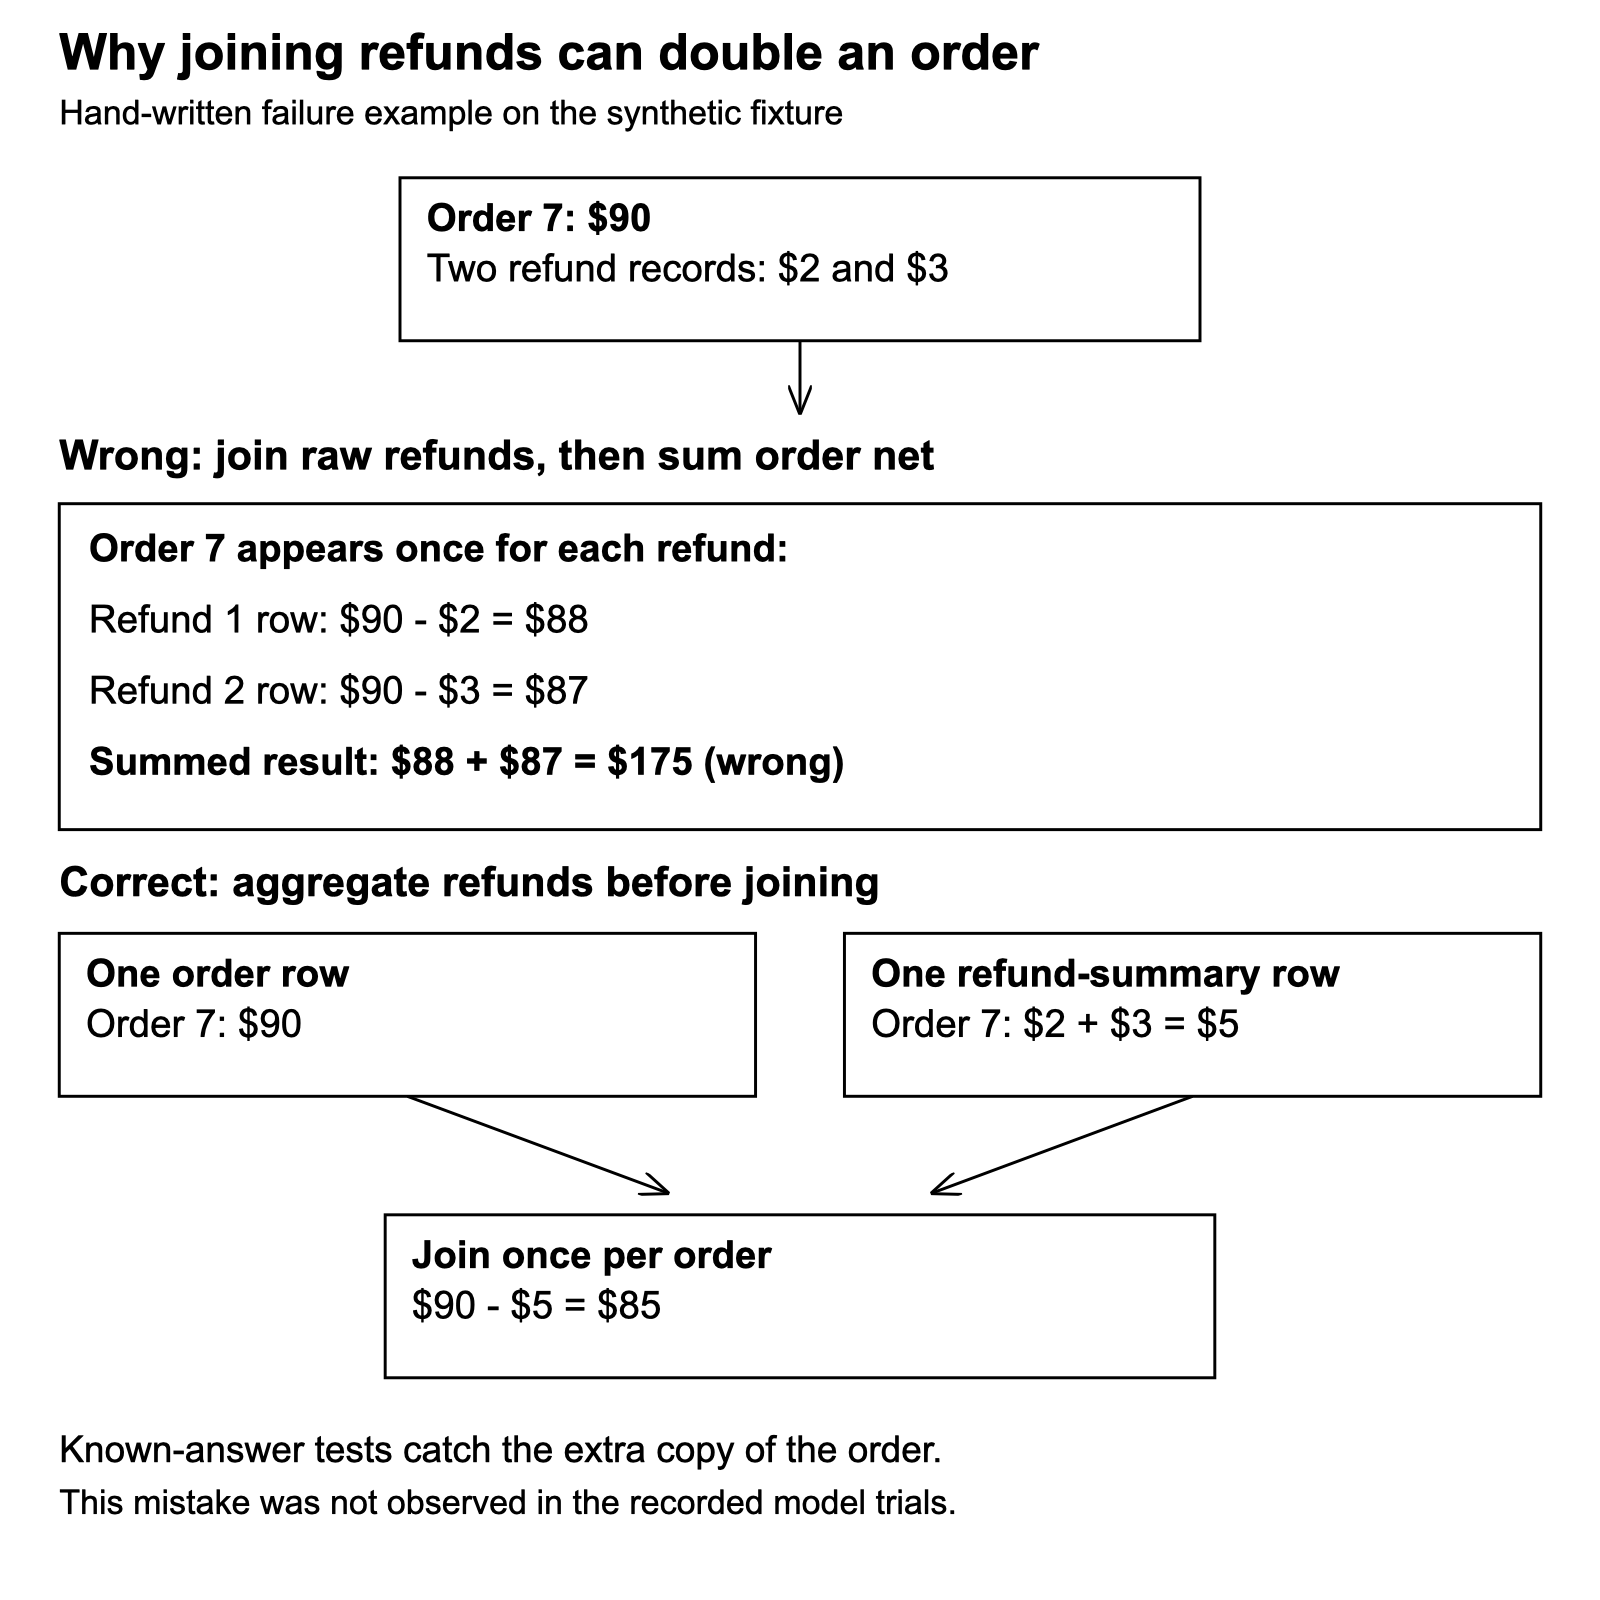
Order 7's one-to-many refund join and repair; original diagram from verified fixture calculations. Full size
For this calculation, sum refunds to one row per order first, then join that summary to the orders. The following reference SQL returns 37,500 cents on the fixture:
WITH refunds_per_order AS (
  SELECT order_id, SUM(amount_cents) AS refunded_cents
  FROM refunds
  GROUP BY order_id
)
SELECT COALESCE(SUM(
  o.gross_cents - COALESCE(r.refunded_cents, 0)
), 0) AS booked_net_sales_cents
FROM orders o
LEFT JOIN refunds_per_order r ON r.order_id = o.id
WHERE o.status = 'paid'
  AND o.is_test = 0
  AND o.invoice_at >= '2026-10-01'
  AND o.invoice_at < '2026-11-01';
There is no refund-date filter in refunds_per_order: all refunds in the fixed snapshot contribute to their original order. The period filter belongs on the invoice date. In a historical implementation, the source snapshot or an explicit as-of rule must also control which refunds were known at the requested time.
Product filters need similar care. If an order contains two WIDGET lines, joining both lines must not count its order value twice. An EXISTS filter can select orders containing WIDGET without multiplying them. Allocating only WIDGET's line-level revenue would be a different metric.
Put known answers beside the SQL
Before connecting an assistant, the team needs a small test dataset whose results it can explain by hand. The same examples should test any later SQL view or metric service.
| Check | Expected result on this fixture | What it catches |
|---|---|---|
| October order-cohort net | $375 | Paid/test filters and refund attribution |
| October net by region | East $145; West $230 | Correct grouping and reconciliation to the total |
| Orders containing WIDGET | $235 | Repeated order lines and refund records |
| One $90 order, two refunds | $85 | Duplicate order amounts after joins |
| October 31 only, UTC | $75 | Date boundaries and later refunds |
| Empty December period | $0 observed in this snapshot | Empty aggregation; not a forecast |
For production, also test missing or delayed inputs. An ingestion failure must not look like a genuinely empty sales period. Access restrictions need separate checks: two consumers can legitimately see different totals if one can only see the East region.
The reference calculations above were checked against the existing Python oracle and SQLite. The extra join example was run separately; the original model-study inputs and results were preserved.
Give the dashboard and AI the same calculation
A small implementation can start with a reviewed SQL view or a metric endpoint. Its definition should live in one maintained place, with both consumers requesting the same metric, dates, dimensions and authorized scope.
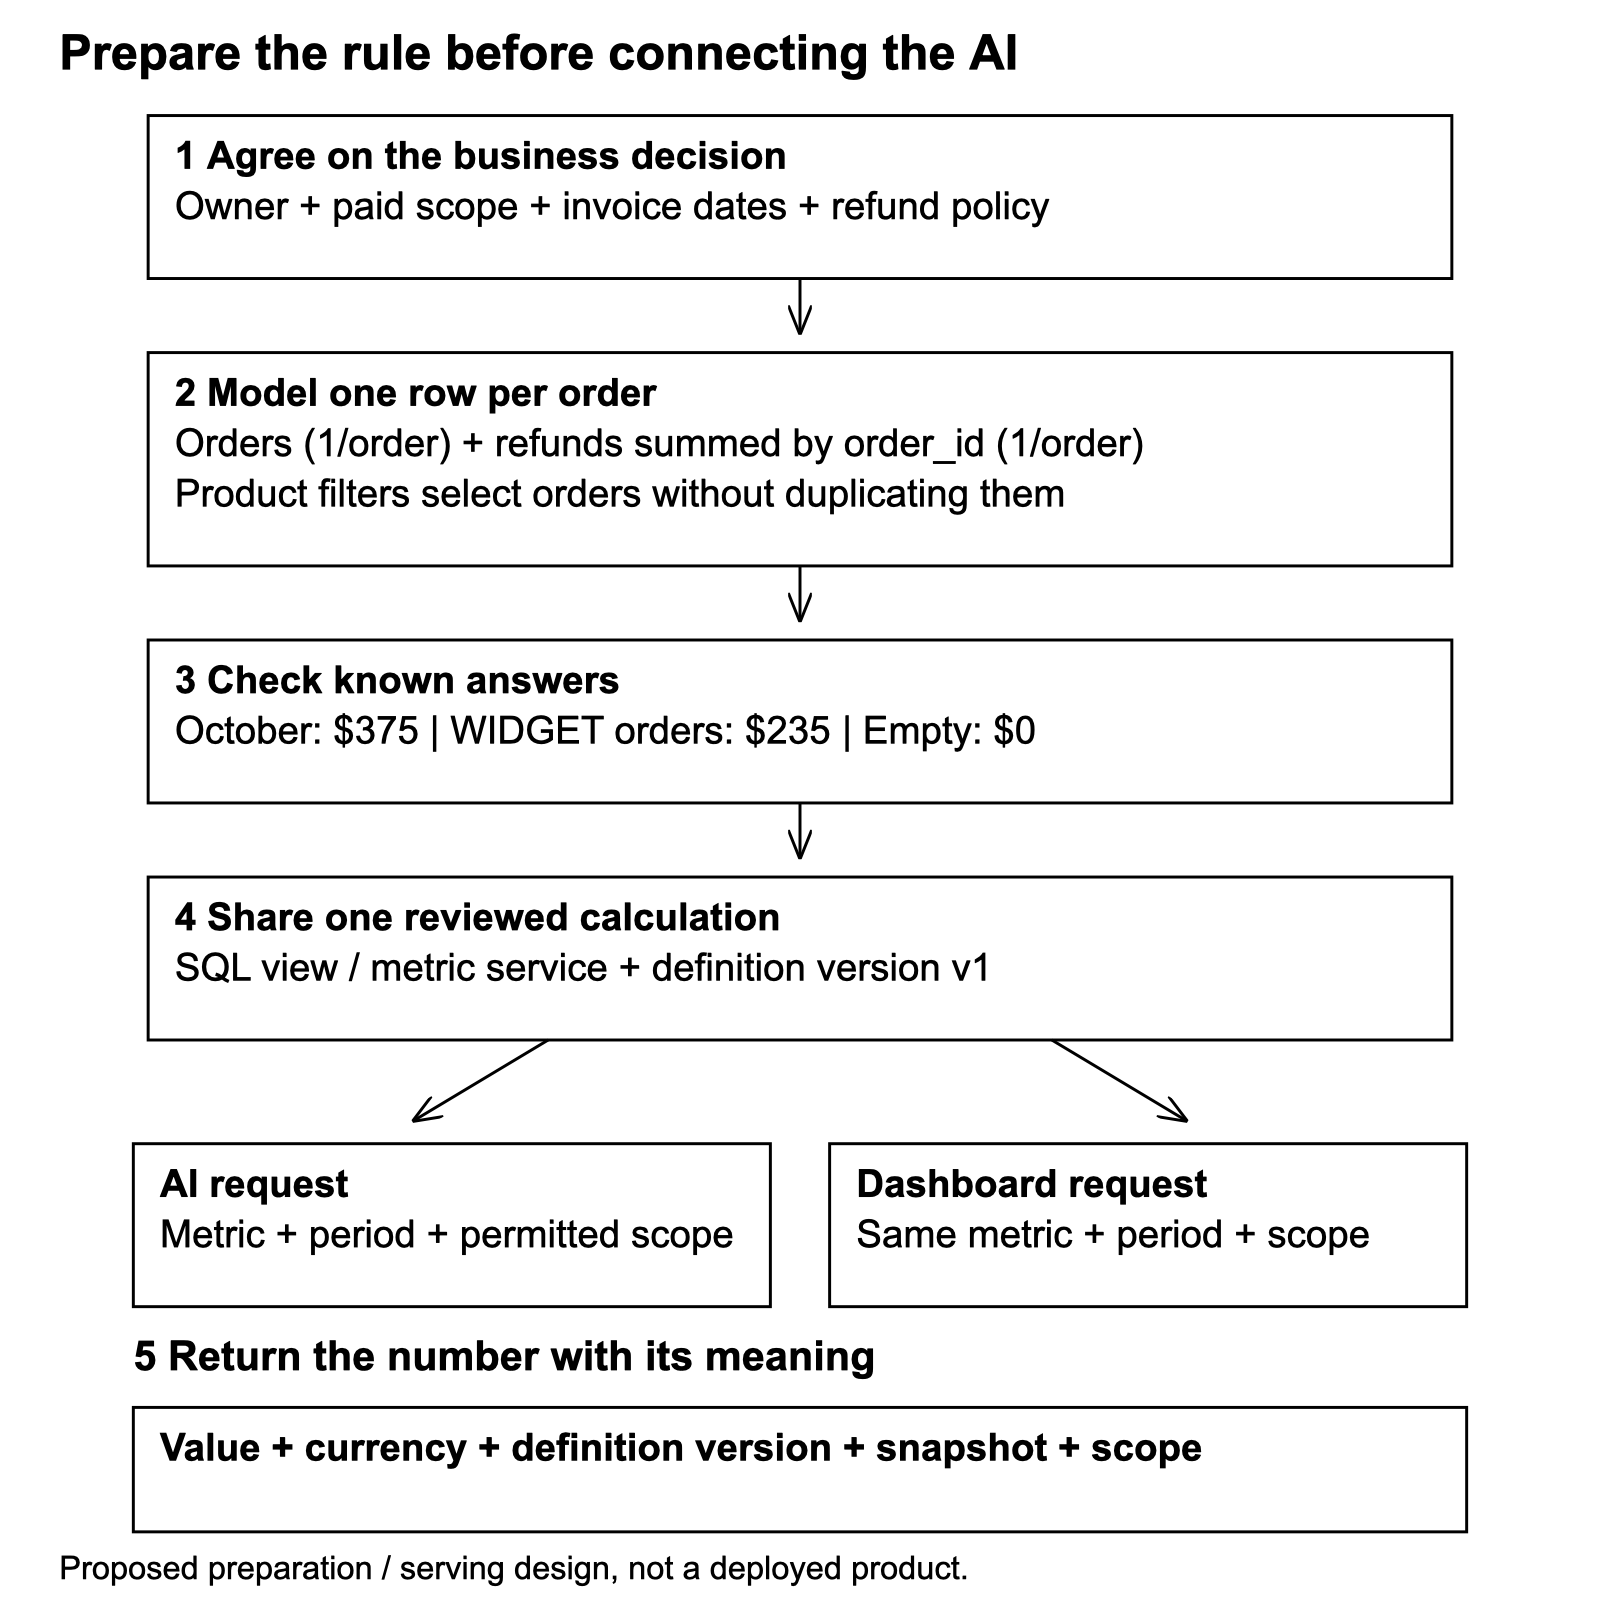
Proposed preparation and serving path; original diagram, not a deployed product. Full size
A semantic layer provides a maintained way to define and serve business metrics across consumers. dbt describes this centralization above existing data models.[3] A product can help organize the contract and execution path; the business team still has to choose the policy.
The request can be small. This is the actual parameter selection from one recorded trial:
{
  "metric": "booked_net_sales_cents",
  "start": "2026-10-01",
  "end": "2026-11-01",
  "dimension": "",
  "sku": ""
}
The trial's controller returned [[37500]]. A reader-facing service should also explain the currency, definition version, source snapshot and access scope. Those response fields are a proposed production design; the original trial did not return a complete audit envelope.
Permissions, refresh checks and version handling must be implemented and tested. A YAML definition or metric name does not supply them automatically. Nor can a shared calculation make two different source snapshots agree.
What the AI experiment actually found
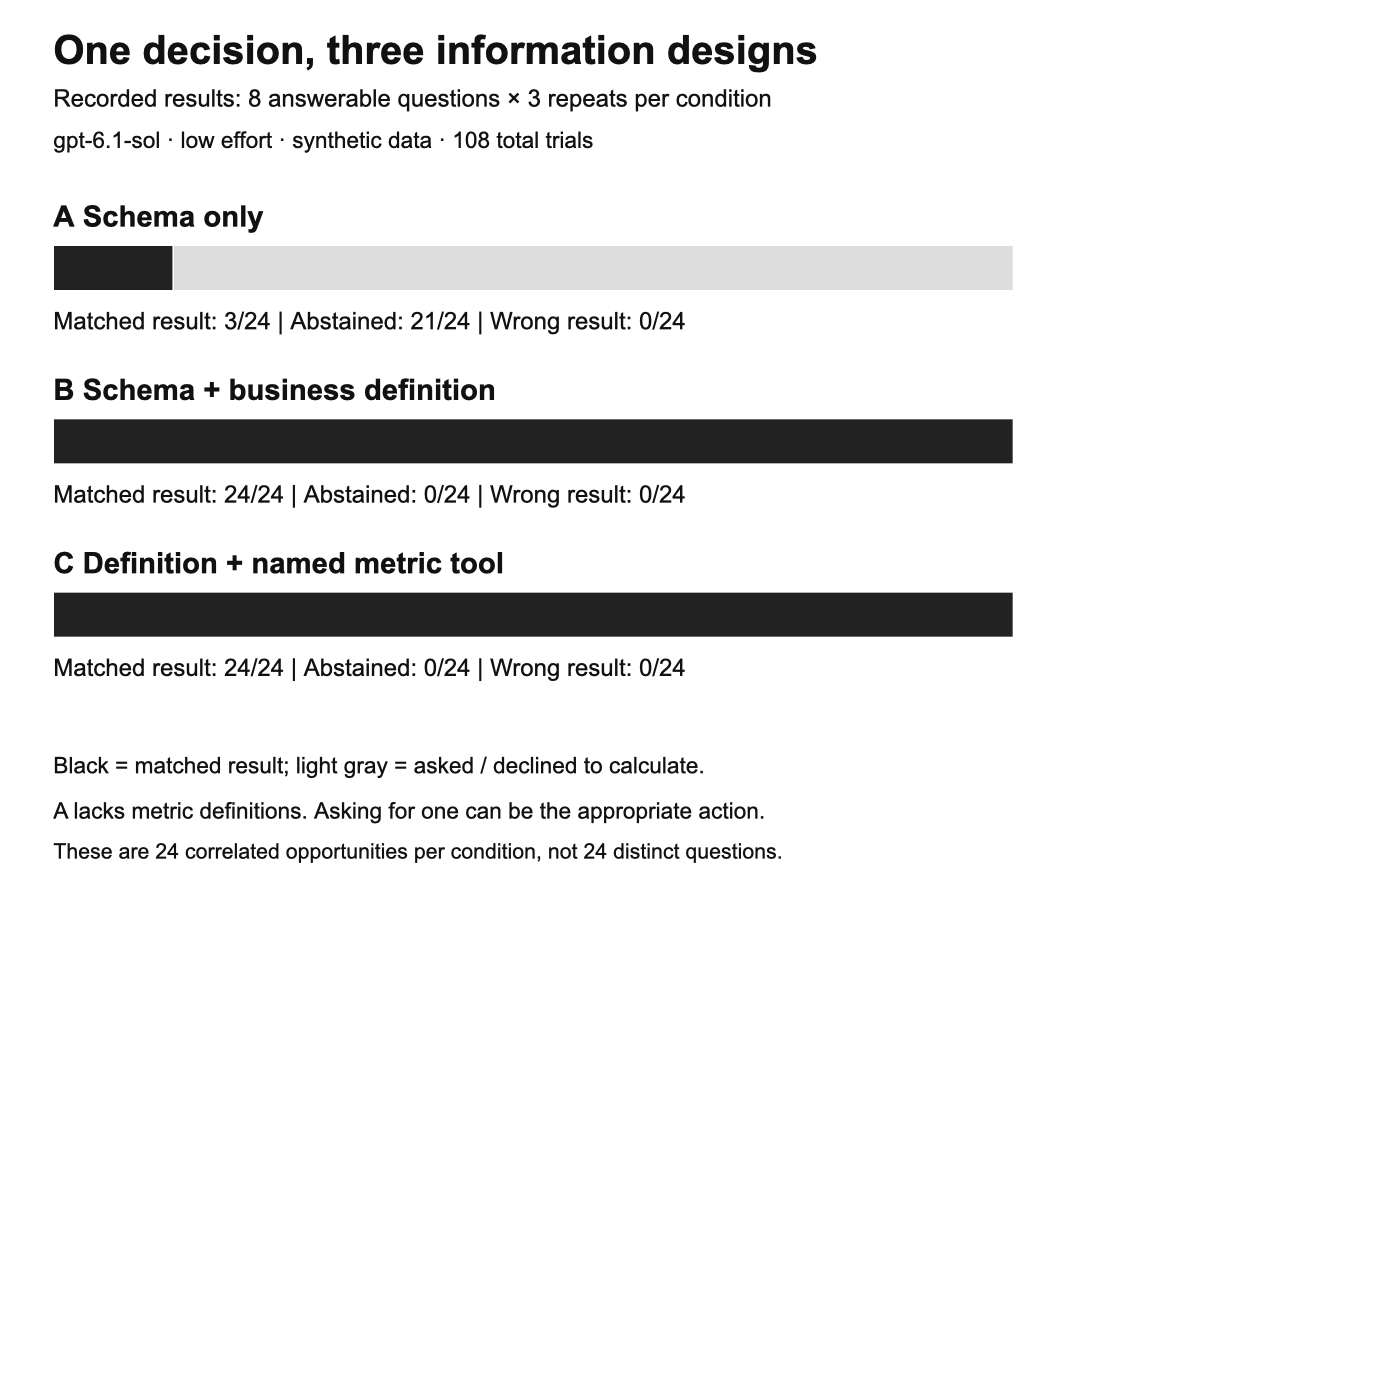
The local experiment used 14 synthetic orders and 12 fixed questions. Each question ran three times in a fresh gpt-6.1-sol session under each condition, giving 108 trials. The model produced one structured decision; an external controller executed the request once.
| Condition | Numeric results matching the reference | Numeric trials asking for a definition |
|---|---|---|
| Schema only | 3/24 | 21/24 |
| Schema plus business definition, generating SQL | 24/24 | 0/24 |
| Same definition, selecting a verified metric request | 24/24 | 0/24 |
The schema-only model did not fabricate a wrong sales number. Its three completions were repeats of a control question that spelled out the calculation. For the seven named-metric questions, it asked for the missing definition every time.
One saved response asked:
How is booked_net_sales_cents defined, including which order statuses qualify, whether test orders are excluded, and how refunds are attributed to October?
All conditions also handled the six ambiguous and six unavailable-information opportunities appropriately. There were no recorded inference, protocol or execution errors. A separate, non-blinded review checked the uncertainty explanations, the 27 generated SQL requests and the 24 metric parameter requests.[4]
The result supports a narrow conclusion: the agreed business definition made these questions answerable. The metric interface had no observed numeric advantage over definition-guided SQL. This small test also supplied explicit aggregation guidance, so it cannot isolate the effect of an ontology or establish general model accuracy.
It did not test a live dashboard, a deployed semantic-layer product, historical snapshot storage, end-user permissions or a model writing a final answer after reading query results.
Put the agreed rules behind the agent's query tool
To test one implementation of this execution boundary, we connected the fixture to sutura 0.11.0, a runtime that executes requests against catalog-defined metrics. The public demonstration adds a small web interface around the actual pinned product binary. Every Run executes sutura; it is not a replay of stored answers or a new LLM conversation.[5]
Expand the demo preview
Choose a scenario, run the actual product, and inspect the SQL and result. The live comparison opens in a new tab.
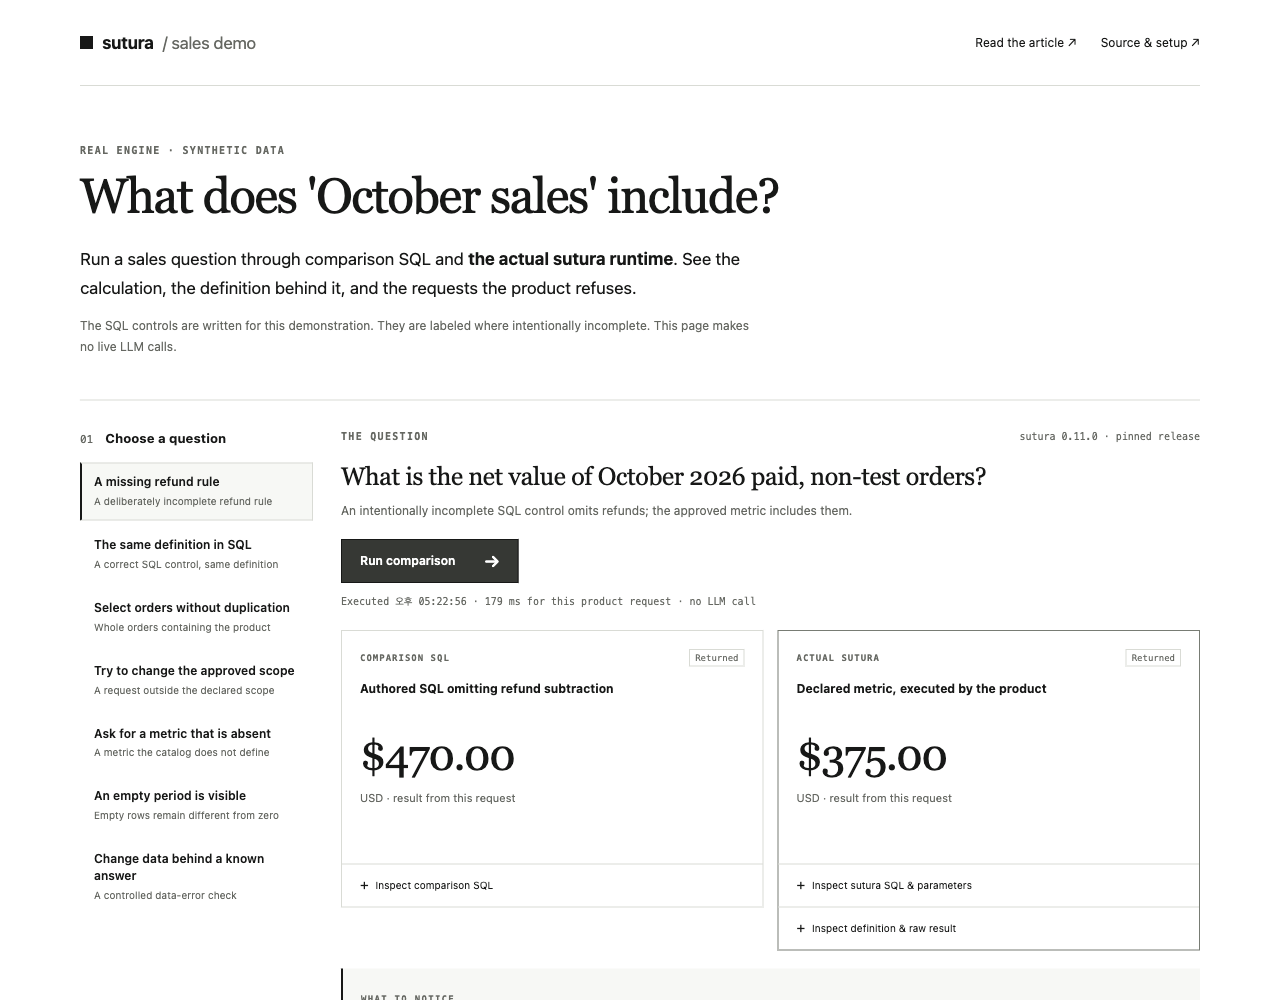
Screenshot from one actual production run.
Start with 'A missing refund rule', then try 'The same definition in SQL'. The first comparison has an intentionally incomplete SQL control; the second uses a correct control that agrees with the product. Both controls are written for the demonstration, not outputs from an AI benchmark.
| What to try | What actually happens | What it tells us |
|---|---|---|
| October net value | The incomplete SQL returns $470; the declared net metric returns $375 | Required rules belong in the shared definition; the missing rule in the control is deliberate |
| Regional net value | Correct SQL and sutura both return East $145 and West $230 | A correct SQL calculation already agrees; there is no observed accuracy advantage here |
| WIDGET orders | Both paths return $235 for whole matching orders | The prepared membership flag preserves our chosen order-cohort meaning |
| Filter the paid metric to pending orders | The off-contract SQL can return $60; sutura refuses the undeclared status dimension | The metric's query surface limits how callers can change its meaning |
| Ask for net profit | The product refuses the absent metric | The catalog does not pretend that sales is profit |
| Query an empty December | The explicit COALESCE control returns zero; sutura returns no rows | Empty-result conventions need an explicit decision; the UI preserves this difference |
| Add $10 to a prepared value | Both paths read the changed copy; ordinary SQL returns $385, while sutura rejects the $375 anchor mismatch | A known-answer check catches this controlled data error; it does not detect every possible error |
Expand the panels to inspect the comparison SQL, sutura's compiled SQL and parameters, its definition digest, and raw result or refusal. The demo-v1 label names our packaged catalog release; the digest is read from the product's actual catalog output.
What we had to prepare ourselves
The source data needed work before the product could use it. We wrote the policy, aggregated refunds into net_cents, prepared whole-order WIDGET membership, and authored the catalog's relationships, permitted dimensions and anchors. An explicit is_production flag uses sutura's supported Boolean predicate. These are our modeling decisions.
Sutura then applies those declared filters, resolves dimensions, compiles and executes the metric query, returns a definition fingerprint and refuses unsupported requests. The repository includes the synthetic source fixture, prepared data, catalog, wrapper and tests so the boundary is inspectable.[6]
The integration also exposed real setup requirements. Our first catalog was rejected because its knowledge contributions were incomplete. An incorrectly authored Boolean comparison failed its anchor execution. Those failures were fixed in the model/catalog configuration; they were not hidden by substituting a stored answer.
What the demonstration establishes
The product makes a reviewed definition executable through a constrained interface, and the small known-answer check visibly rejects one deliberately introduced error. This is a concrete way to inspect definition enforcement and traceability.
It does not establish an improvement in AI answer accuracy. The live comparisons use authored SQL controls and make no LLM calls. Refund modeling, historical snapshots, freshness, user-specific access and broader performance still need their own implementation and tests. Those limits matter even when a query returns the expected $375.
Run a scenario, inspect its SQL, and trace the result back to the shop's agreed rule. That is the connection this demonstration is intended to make visible.
References
- Shopify. Sales discrepancies in Shopify Analytics. Timing, returns/refunds and report/export differences; accessed November 6, 2026. This documents the problem class, not the synthetic shop's custom formula.
- dbt Labs. Semantic models. Entities, time dimensions and grouping dimensions; accessed November 6, 2026. No version-specific product configuration is being supplied here.
- dbt Labs. dbt Semantic Layer. Central metric definitions across downstream consumers; accessed November 6, 2026.
- Author's original synthetic experiment, November 6, 2026. Recorded outcome figure. 108 preregistered trials, raw decisions and separate manual audit retained locally; original self-reported evidence, not an independent benchmark.
- Deutsche Telekom. sutura source and documentation. Catalog/query workflow consulted for the actual 0.11.0 integration; runtime image pinned by digest in the demonstration repository.
- Author. sutura-sales-demo. Synthetic fixture, manually prepared fields, metric catalog, live wrapper and reproducible tests. Product execution and deliberately authored controls are distinguished.